

Bitcoin has come closer to establishing its longest-running bear market, alarmed Alex Kruger.
The famous cryptocurrency trading analyst said Monday that it was the first time bitcoin had entered a long period of selling sentiment in its 10-year history. In December 2017, the value of bitcoin per piece was close to $20,000. As of January 31, 2018, it was close to $3,450. That marks a circa 82% drop in 13-months.
History of Bitcoin Bear Trends
Technically, Bitcoin has already established its most extended selling phase by beating its previous bear market with four days. Between December 16, 2017, and now, a total of 415 days posted a negative return of 82.53%. Considering the bear market has ended for the same period, and the bitcoin’s previous bottom was the closure, then the digital currency saw an 84% drop between December 16, 2017, and December 15, 2018 – that is 364 days.
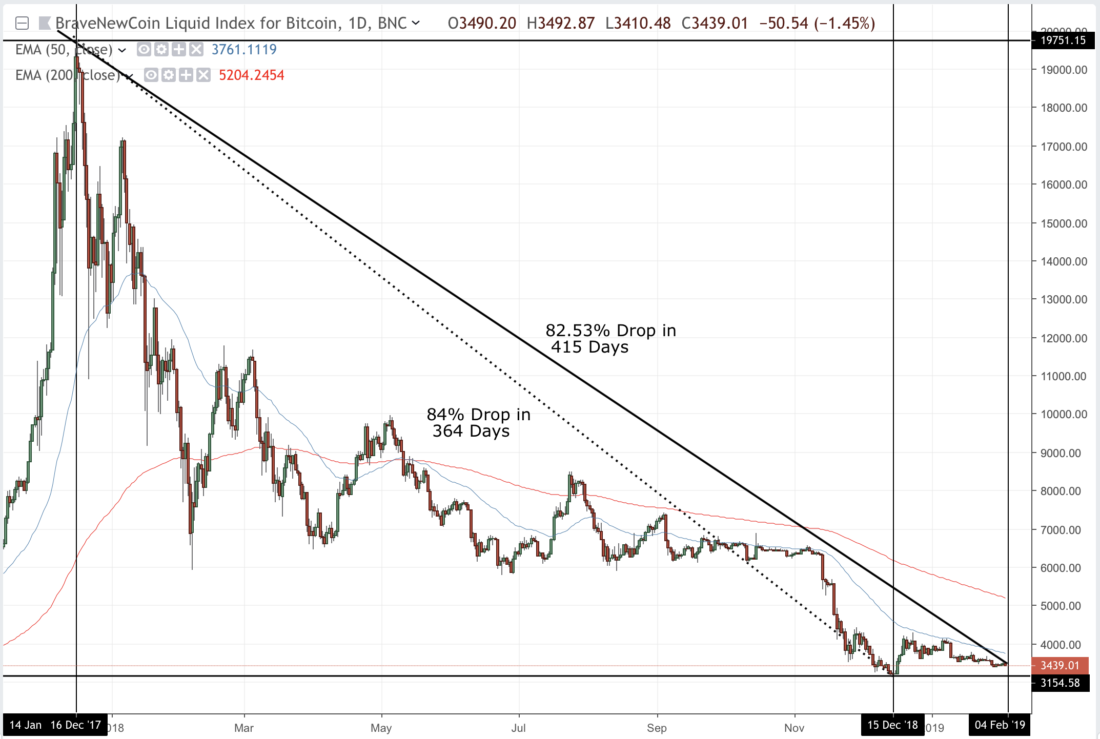
Bitcoin Bear Cycle since December 14, 2017. | Source: TradingView.com
The previous Bitcoin bear cycle that spanned between 2013 and 2015 lasted for 411 days. In it, the digital currency lost 86.45% of its value after falling from $1,178 to $114.
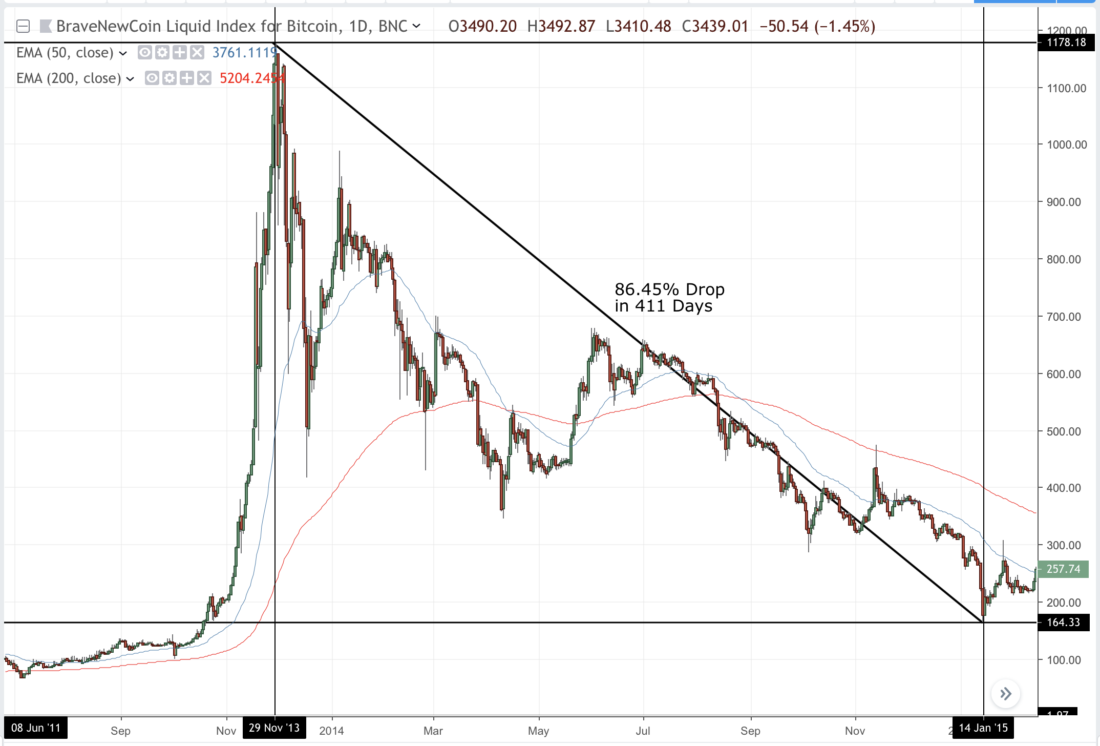
Bitcoin Bear Cycle between November 29, 2013, and January 14, 2015. | Source: TradingView.com
In comparison, the shortest and the worst bear cycle was in 2011. The year saw Bitcoin price declining 93.85% in just 163 days – from $32 to $1.97.
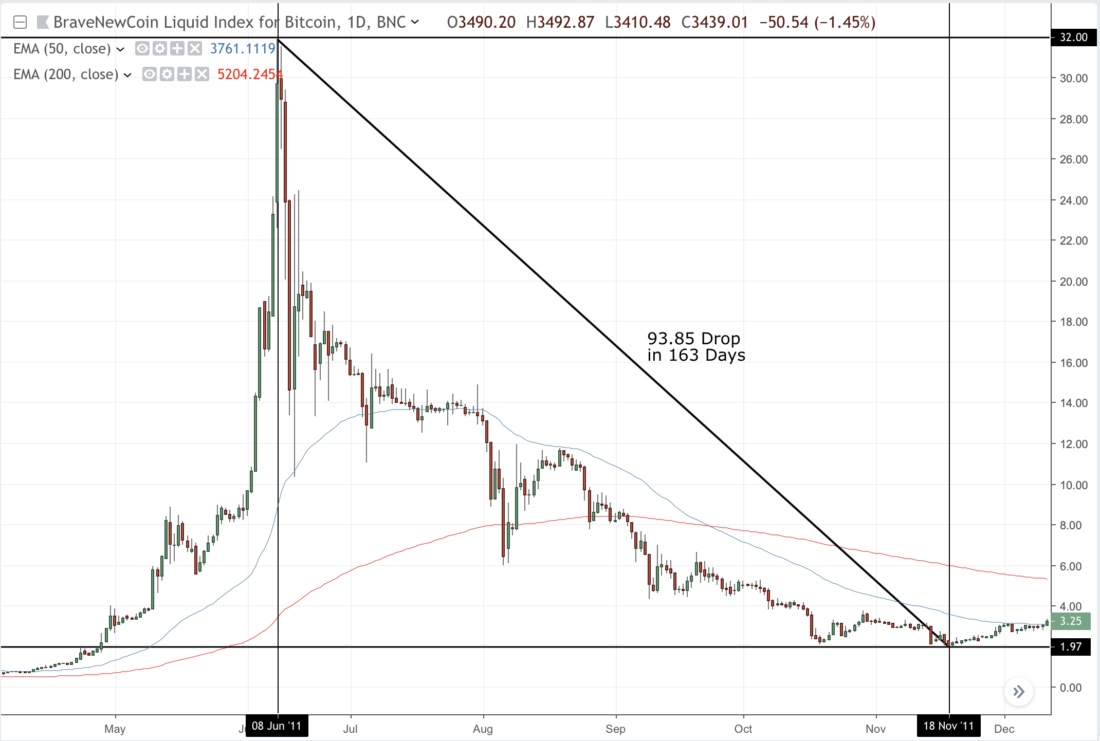
Bitcoin Bear Cycle between June 8, 2011, and November 18, 2011. | Source: TradingView.com
Bitcoin’s ongoing price drop was the lowest compared to the other two declines.
The Next Bullish Revival in Bitcoin Market
Every Bitcoin’s bearish cycle – except the ongoing one – has seen a sharp upside reversal. The 2011’s crash followed a bull run towards $1,178. Later, the bearish cycle between 2013-2015 transformed into a strong upside momentum towards $19,751. If history matters, the ongoing bearing phase could also result in a sharp correction, followed by a new bull run.
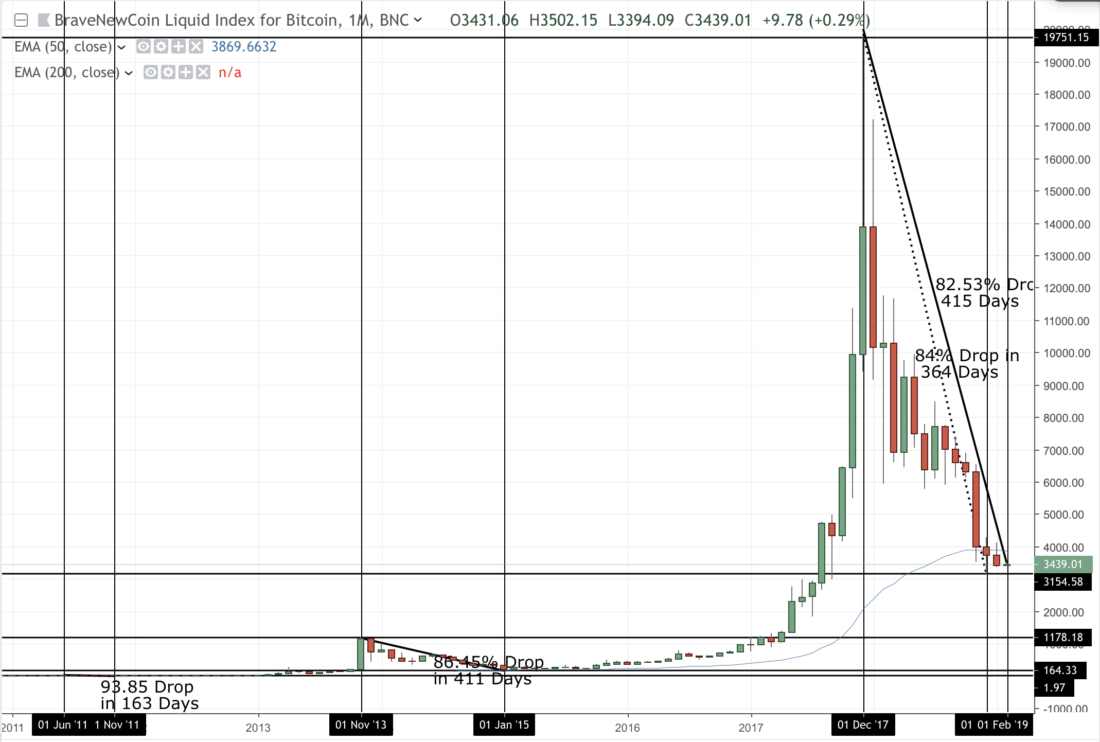
Three Bitcoin Bear Cycles between 2011 and 2019 | Source: TradingView.com
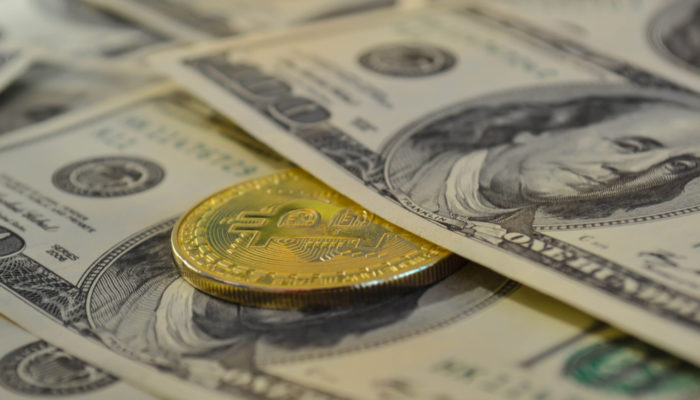
Bitcoin attracted early investors with a promise to revolutionize banking with its decentralized finance features. Later, it became a speculative vehicle for retail investors who were excited because of Bitcoin’s intraday volatility.
The crash in 2018 deterred shaky hands from the crypto market. Bulls now believe that institutional investments would drive the Bitcoin prices up. However, analysts also say that the ongoing bearish market has not ended yet – it would probably conclude when bitcoin price will bottom out near $1,500. While it cannot be said how long would the bitcoin bears will stay, some instances from the mainstream market can explain the nature of bear markets.
A Macroscopic View of Bear Trends
Since World War II, an average bear market in traditional financial markets has lasted at an average of five months per cycle. The S&P 500’s most extended bear market continued for 61-month upon its end in March 1942, while its shortest bear market survived three months with a 20% decline in 1990. However, the S&P noted its most significant decline since 1945 in the 2007-2009 recession market, in which it lost 56.4% of its value in a 17-month long bear market.
At the same time, a bull market cycle survives at an average of 4.5 years. As of now, the bull market has lasted for almost over a decade, and the signs of first bearish breakdown have begun to appear. Investors could confirm the next upside correction if the market – S&P, Bitcoin and whatnot – rise at least 20% from its current low. The correction should also extend for a minimum of six months to signal the revival of bulls.
By that mainstream logic, the next bull target for Bitcoin should be above $4,200.